|
|
|
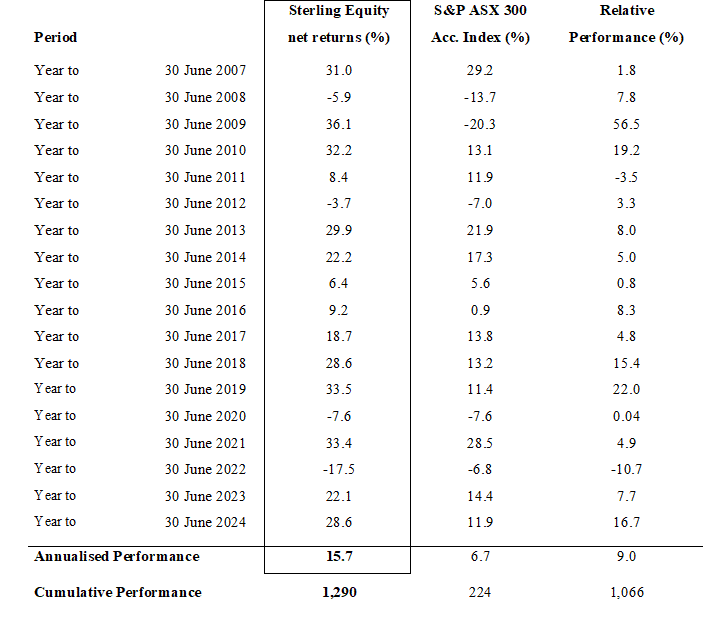
Sterling Equity’s returns since inception are presented in the table below.
The graph below presents Sterling Equity performance, net of fees and expenses, assuming an initial investment of $1,000,000.
1 Sterling Equity’s return is reported on an after fees basis, but is before taxes. The Australian share market, as measured by the S&P ASX 300 Accumulation Index, is reported before fees and taxes. Past performance is not a reliable indicator of future performance. |


